Unveiling the Magic: Visualizing Matrix Transformations
Understanding matrix transformations might seem daunting, especially if you’re not familiar with the world of mathematics. However, they are a crucial concept in many fields, including computer graphics, physics, and machine learning. By visualizing matrix transformations, we can better comprehend the seemingly complicated operations and uncover the magic behind how matrices manipulate and reshape data. The purpose of this blog post is to demonstrate simple transformations using Desmos for visualization.
Creating the Grid
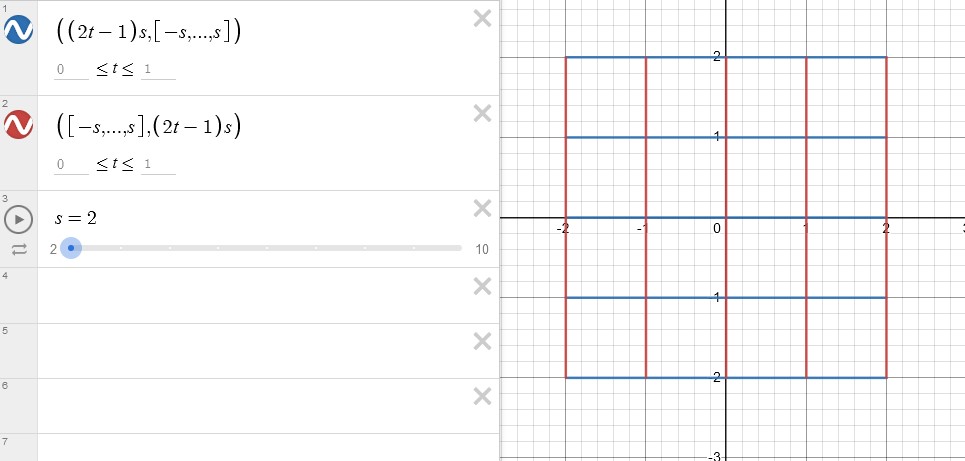
To create a grid, we can use a parametric equation. Suppose we want to create a 2 by 2 grid. In that case, we need to keep the value of $y$ constant while letting $x$ range from -2 to 2, and vice versa. We can generalize the equation to cover a wider range of values, where $x$ ranges from $-s$ to $s$ when $t$ goes from 0 to 1. The equation is $$-s(1-t)+st $$ $$ = (2t-1)s$$ If we set $t$ to 0, the equation returns $-s$. On the other hand, if we set $t$ to 1, the equation returns $s$. We can assign values to $y$ that range from negative s to positive s, $y=[-s,\cdots,s]$.
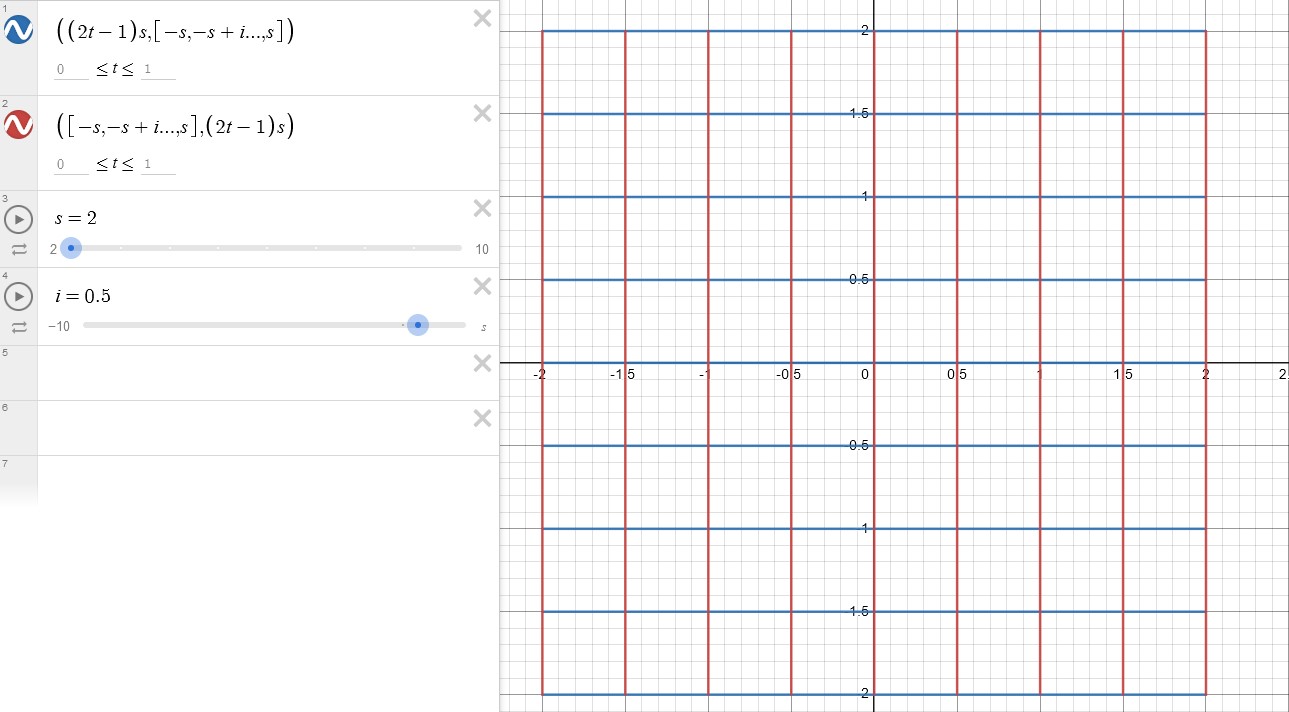
By setting the value of s=n, we can create a grid with n rows and n columns.Also, you can use the list [-s,-s+i,…,s] to draw lines after increment i.
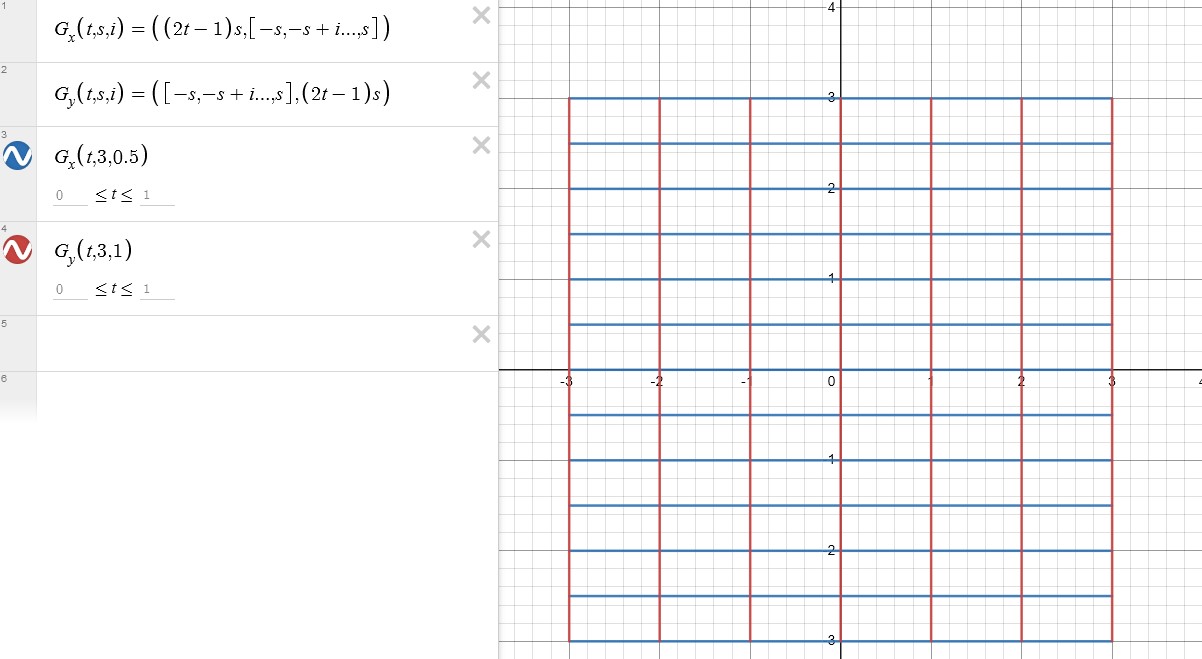
We can now create a function to generate a grid and call it whenever needed.
Transformations
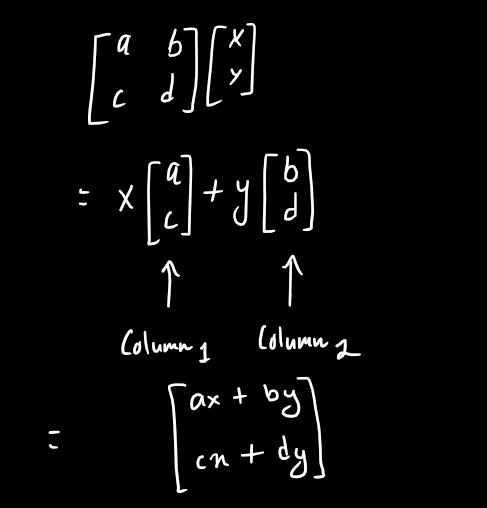
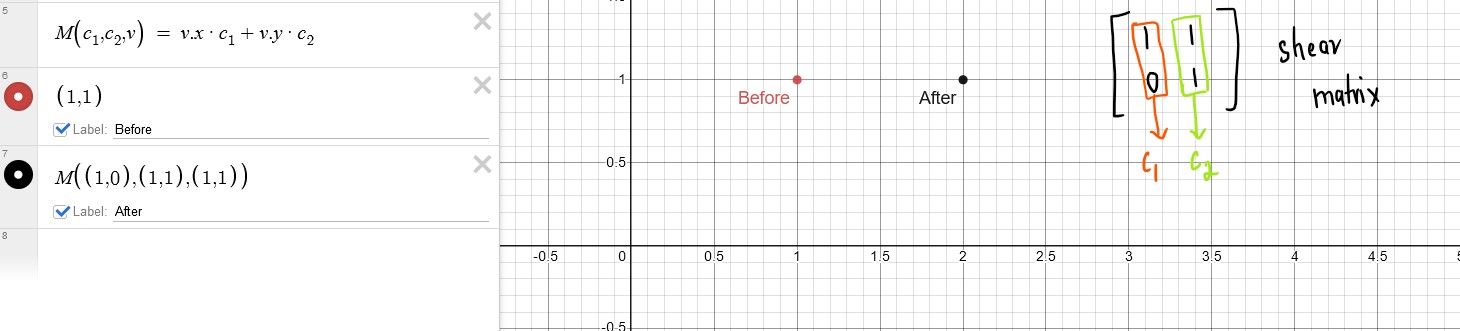
The above picture illustrates matrix multiplication.We can create a function in Desmos to perform a 2D matrix multiplication. This function will take columns of the matrix and a point as parameters. The output of the function will be the transformed result of the matrix multiplication.
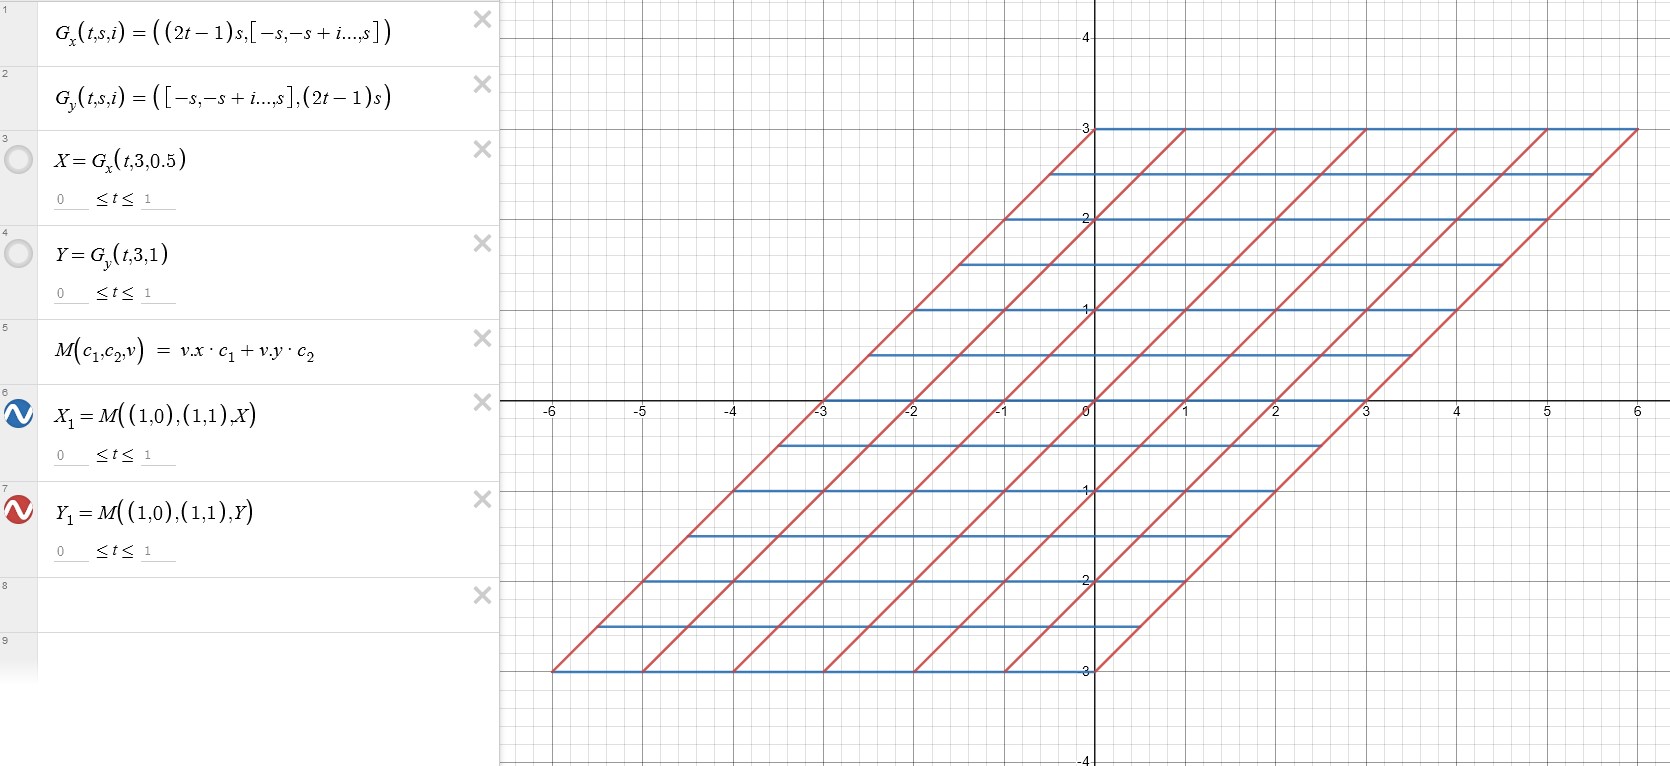
Now, instead of a point as the input, we can use grid. Remember to assign the grid to a variable to simplify the process.
Now, for the transformation part, it’s quite simple and might just surprise you. Let’s name our starting grid as $X$ and the transformed grid as $X_1$. To move from $X$ to $X_1$,we use the formula: $$ X(1−t_1)+X_1t_1 $$ Here, $t_1$ ranges from 0 to 1, covering the entire transformation process. I believe there’s no need to explain how this works.
Now that you know how to create a grid in Desmos, you can explore numerous possibilities. Here are some Desmos links—give them a try yourself and enjoy! Thank you for reading this blog.